
How UK wages compare to energy bills
Quiet Meadow tracks the divergence between British household pay packets and domestic utility costs. Over the past four years, standard domestic gas and electricity tariffs moved from a predictable background expense into a primary driver of household financial strain. We bring together official earnings figures and regulatory tariff releases to show how purchasing power shifted across regions and income brackets.
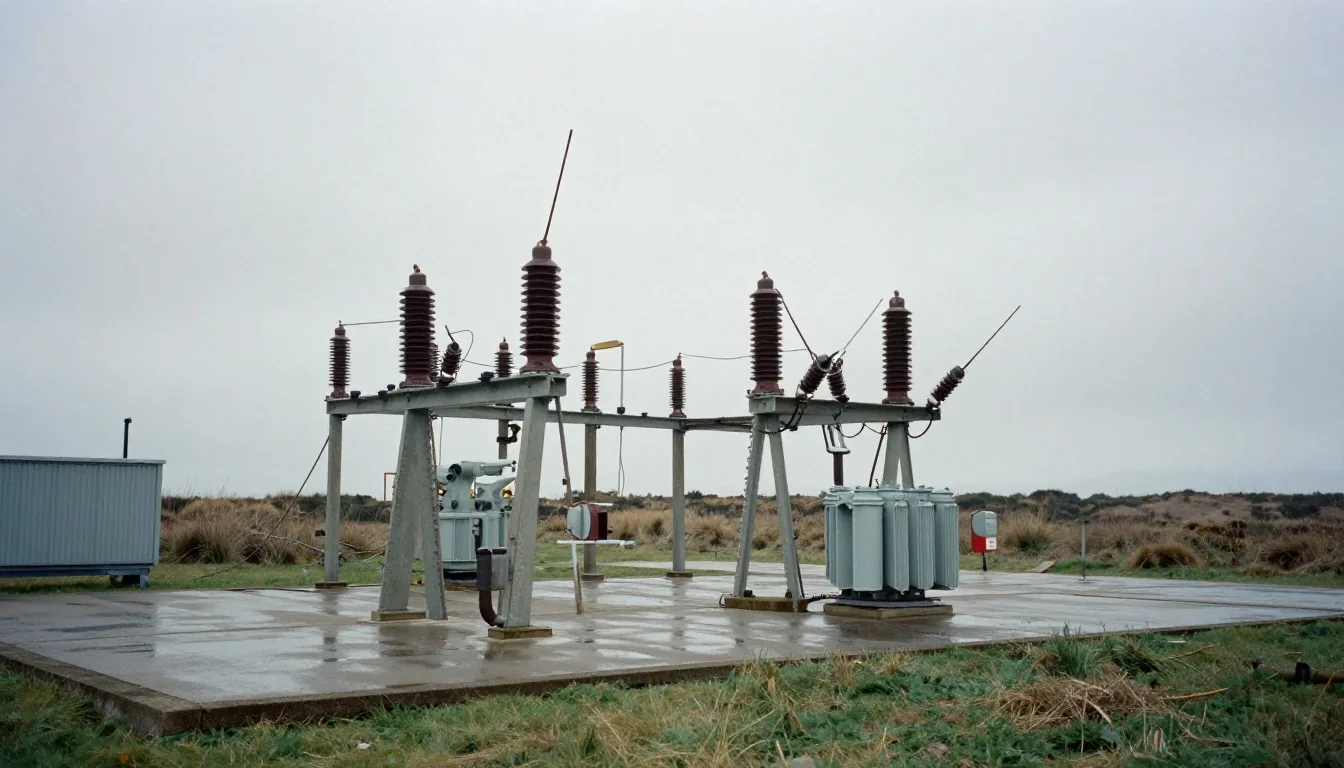
Representative dual-fuel expenditure across median full-time pay scales under standard credit and direct debit regimes.
Reconciling regular weekly earnings indices with quarterly default tariff caps, standing charge rates, and distribution fees.
Access complete public indices, regional distribution models, and tariff decomposition.
The current split between earnings and utility costs
Nominal wage increases reported by the Office for National Statistics often suggest stable household recovery. Yet when energy bills take up a doubled share of monthly net income, nominal improvements vanish quickly. A household earning the UK median salary in 2020 spent approximately four percent of take-home pay on dual-fuel utilities. In recent regulatory cycles, that proportion fluctuated between seven and eleven percent depending on property insulation and heating demand.
This mathematical compression creates an immediate gap between official disposable income statistics and bank balances. Even when gross weekly pay steps upward by fifty pounds, an increase in unit electricity rates combined with persistent standing charges absorbs the majority of the surplus before discretionary spending begins.
Of net median income allocated toward dual-fuel domestic utility obligations under standard annual consumption profiles.
Proportion of take-home earnings consumed by standard heat and light across average and poorly insulated homes.
Nominal wage gains are largely offset by fixed billing friction
Because utility outgoings are inelastic, price movements in baseline electricity and gas represent direct taxations on disposable capacity.
Measuring real wage trajectories against headline inflation
Wage reporting frequently blends public and private sector earnings, smoothing out distinct pressure points across working households.
Wage reporting frequently blends public and private sector earnings, smoothing out distinct pressure points. Private service sectors saw irregular bonus-driven spikes, whereas public sector and basic hourly pay lagged behind composite consumer inflation. When essential outgoings such as heating and electricity rise faster than general retail goods, standard inflation figures understate the cash reduction felt by working families.
A composite Consumer Prices Index (CPI) weights recreation, electronics, and apparel alongside basic utility charges. When electronics prices fall while kWh unit prices remain elevated, headline CPI decelerates artificially—giving the false impression that cost-of-living strain has receded.

How the Ofgem price cap sets domestic tariffs
The Office of Gas and Electricity Markets (Ofgem) establishes a default tariff cap every quarter. This cap does not set a maximum total bill; rather, it limits the unit rate for kilowatt-hours and the daily standing charge that suppliers can bill domestic consumers. Understanding this distinction clarifies why two households with identical energy contracts receive vastly different monthly statements based strictly on dwelling type, occupancy, and regional distribution tariffs.
Wholesale Energy Allowance
Calculated from forward contracts traded across the National Balancing Point (NBP) gas market and wholesale power exchanges. Represents roughly half the overall domestic tariff.
Network & Transmission Costs
Reimburses distribution network operators (DNOs) and National Grid for maintaining physical cables, high-voltage transformers, and high-pressure gas mains across Britain.
Policy Levies & Administration
Funds social programmes like the Warm Home Discount, green energy transition subsidies, and mutualised industry costs associated with historical supplier failures.
Standing charges and their impact on low energy users
Standing charges remain due regardless of whether a property consumes gas or electricity on any given day. These daily fixed costs cover pipeline maintenance, regional network charges, and the costs of failed supplier administrations. Because standing charges apply uniformly across usage levels, smaller flats and energy-conscious households pay a disproportionately high effective rate per unit of energy actually consumed.
For a single-person household carefully rationing space heating to save money, the combined standing charge for electricity and gas frequently accounts for more than thirty percent of their overall monthly statement. This reality undermines the effectiveness of personal conservation: turning thermostats down cannot eliminate the fixed structural toll imposed by simply remaining connected to the grid.
Standing Charge Composition Breakdown
The role of wholesale gas in electricity pricing
Great Britain relies heavily on combined-cycle gas turbine plants to balance the electrical grid when renewable generation drops. Because the power market operates on a marginal pricing framework, the most expensive generation asset required to meet demand sets the wholesale clearing price for all generators. As a consequence, volatile wholesale natural gas prices translate immediately into elevated electricity bills for consumers across England, Scotland, and Wales.
Even when offshore wind farms produce forty percent of the country's electricity at near-zero marginal cost, the retail clearing price is anchored by gas turbine fuel burn.
Read energy news context
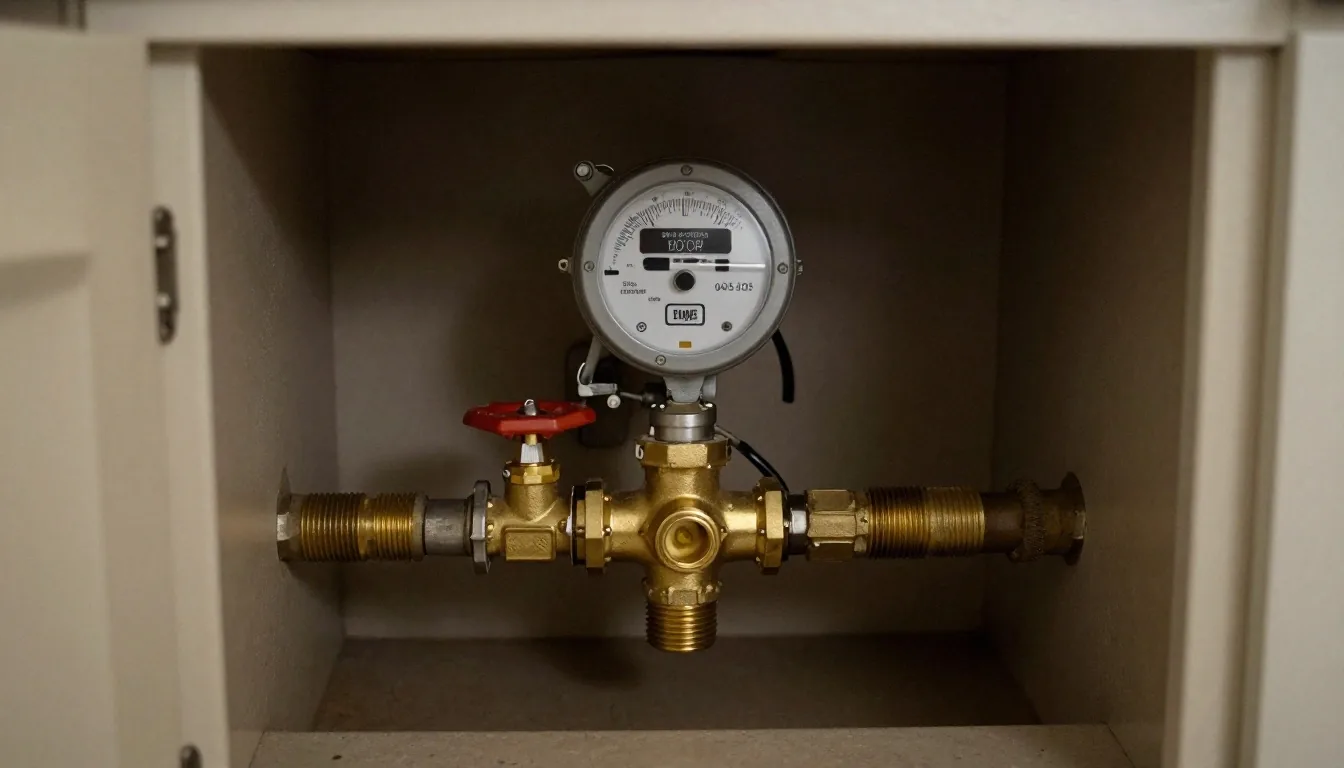
Wholesale price spikes at European gas hubs transfer into British electricity forward contracts within 48 to 72 hours.
Regional variations in utility burdens
Energy distribution costs are not uniform across the country. Households in North Wales, Merseyside, and the South West face higher distribution network charges than residents in London or the East Midlands. When these regional network costs combine with lower median wages in former industrial or rural areas, the net pressure on disposable income increases sharply.
| Distribution Region | Relative Standing Charge | Median Full-Time Wage | Estimated Income Share |
|---|---|---|---|
| North Wales & Merseyside | Elevated (+12% vs London) | £610 / week | 9.8% |
| South West England | Elevated (+14% vs London) | £625 / week | 9.4% |
| North East & Yorkshire | Moderate (+4% vs London) | £595 / week | 9.7% |
| London Metropolitan Area | Lowest regional unit/standing base | £820 / week | 6.4% |
Housing stock efficiency and heat loss
The structural condition of British housing amplifies the gap between earnings and utility expenses. The United Kingdom maintains some of the oldest, least insulated housing stock in Western Europe, with millions of pre-1919 solid-wall properties still relying on gas central heating. Poor thermal retention means that a family in a poorly rated dwelling must consume significantly more kilowatt-hours to maintain a baseline internal temperature of eighteen degrees Celsius.
An Energy Performance Certificate (EPC) rating difference between Band C and Band E can represent more than eight hundred pounds in additional annual fuel requirements for identical physical floor plans. Lower-income households are disproportionately concentrated in older private rentals where structural retrofitting remains uncommon.
Typical space heating requirement in modern cavity wall insulation with double glazing.
Typical space heating requirement for solid-wall pre-1919 terraced property under standard heating hours.
Assessing the impact on lower income quintiles
Households situated in the lowest two income quintiles spend a far larger fraction of their earnings on non-discretionary expenses. When energy costs climb, these households cannot cut back on luxury expenditures to compensate. Instead, spending reductions fall directly on groceries, transport, and personal savings, creating a sustained contraction in living standards that persists even during quarters where headline energy prices drop slightly.
Why government support schemes were temporary
Interventions like the Energy Price Guarantee and direct bill discounts offered short-term relief during peak market volatility. However, these programs acted as temporary fiscal cushions rather than structural reforms to market mechanisms. Once universal support measures concluded, consumers returned to paying baseline rates that remained forty to sixty percent above pre-crisis norms, keeping energy affordability at the center of personal finance decisions.
What current energy market news means for future budgets
News reports concerning pipeline flows, liquefied natural gas shipments, and geopolitical tensions directly influence forward contracts traded on wholesale markets. These wholesale movements dictate the ceiling that Ofgem establishes two months later for subsequent quarters. Tracking these market signals gives households and budget planners a practical window into upcoming tariff adjustments before they appear on billing statements.
How do LNG tanker arrivals at Milford Haven impact retail electricity rates?
Why do quarterly tariff announcements lag wholesale spot market price drops?
Can renewable generation decouple household power bills from natural gas?
Our monitoring approach and public datasets
Quiet Meadow relies exclusively on public, verifiable data sources to evaluate household cost pressures. We draw monthly employment figures from the ONS, tariff component data from Ofgem, and wholesale commodity benchmarks from market operators. We do not accept commercial sponsorships from energy suppliers, ensuring our commentary provides clear, neutral analysis for researchers, journalists, and households.
Every model and dataset on this platform is documented with complete citations, allowing visitors to inspect calculation methodologies, verify underlying assumptions, and compare historical revisions without opaque corporate intermediation.
Office for National Statistics (ONS)
Labour Market overview releases, Average Weekly Earnings (AWE) series, and regional Household Expenditure surveys.
Ofgem Default Tariff Cap Releases
Quarterly unit rate caps (p/kWh), daily standing charges (p/day), and comprehensive methodology spreadsheets.
Public Sector Neutrality Guarantee
Strict adherence to non-commercial commentary; zero promotional referral arrangements or energy brokerage partnerships.
Navigating the resources on this platform
Our platform splits complex economic data into accessible guides covering wage stagnation, tariff breakdowns, and demographic models. Readers can evaluate their own income bracket against average regional tariffs or review contextual summaries explaining energy sector headlines. Use the navigation links below to examine specific data series and market analyses.
Wage Trends & Inflation
Real hourly earnings vs CPI sub-indices across public, manufacturing, and private service sectors.
Energy Costs Explained
Comprehensive technical guide to standing charges, unit rates, and distribution network operational expenses.
Household Budget Models
Simulations comparing monthly energy outgoings across five income quintiles and differing property EPC grades.
Energy News Context
Objective breakdowns explaining why pipeline maintenance, gas storage figures, and grid balance feature in the news.
Examine the analytical foundation
Whether reviewing regional standing charge variances, tracking inflation-adjusted wage erosion, or requesting data citations for research purposes, our analytical resources remain open and verifiable.