
How utility costs absorb household earnings
The impact of rising domestic energy costs is not distributed evenly across British society. While higher-income households absorb increased standing charges and unit rates by adjusting discretionary spending or reducing savings contributions, lower- and middle-income families face immediate trade-offs with essential living costs. This docket outlines how differing household configurations and income brackets experience the utility price shock across the UK.
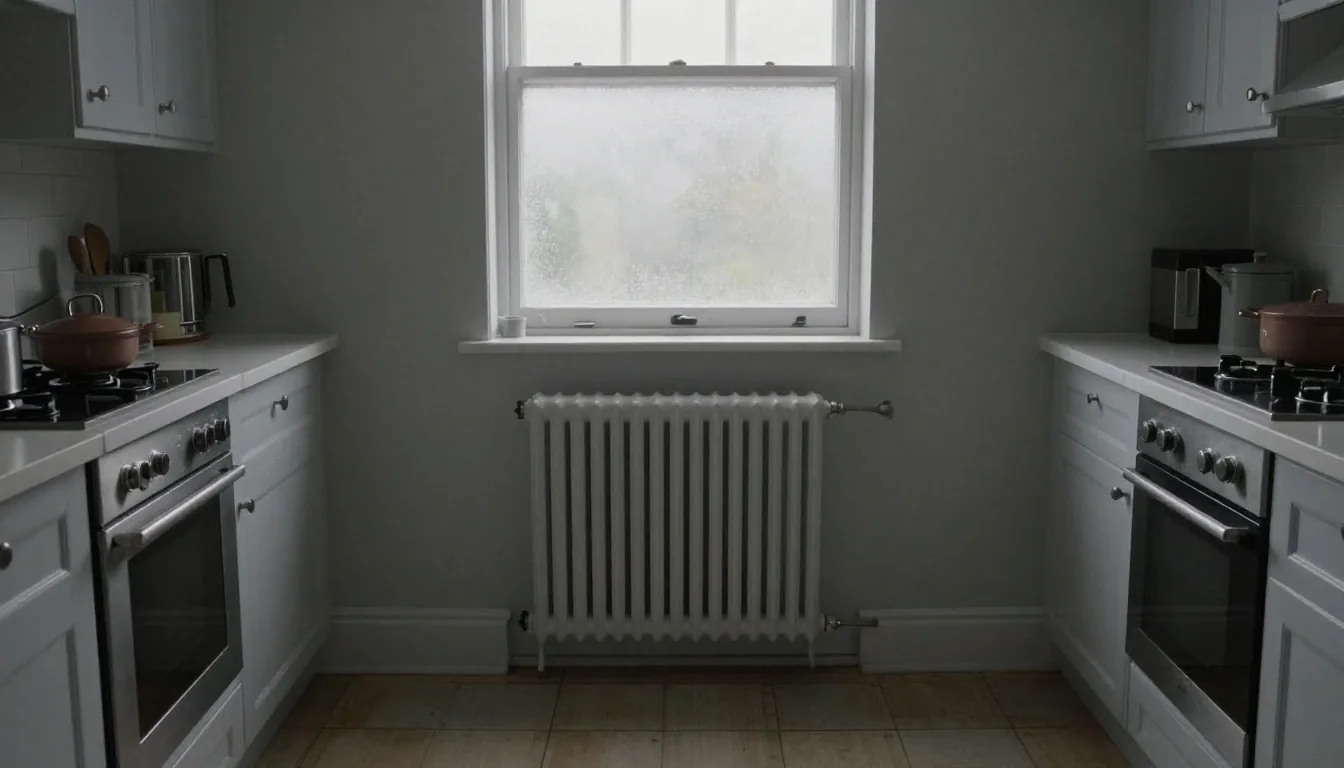
Lowest twenty percent of UK earners commit more than one in seven take-home pounds directly to basic standing charges and baseline heat.
Highest quintile households absorb identical volumetric unit price escalations through modest discretionary buffer reductions.
Explore Household Metrics
Review our structural wage trend calculations or evaluate detailed wholesale energy tariff mechanisms.
Utility expenditure by income quintile
Dividing the UK population into five equal income quintiles demonstrates the regressive nature of utility costs. For the highest quintile, energy bills typically account for two to three percent of monthly net income, representing an inconvenient but manageable budgetary change. For the lowest income quintile, energy costs can consume fifteen percent or more of net take-home pay, leaving minimal flexibility for other basic needs.
Why percentage burden matters: Because energy tariffs function effectively as a flat volumetric tax, families with lower incomes bear a disproportionate fiscal burden compared to affluent households whose consumption represents a small fraction of their cash flow.
Single-earner households and fixed-cost penalties
Single adults living alone or single parents face a structural disadvantage under the current billing framework. Daily standing charges apply equally whether a home houses one person or four. A single earner must meet the exact same fixed standing charges out of one income, meaning their per-person cost of maintaining an energy connection is significantly higher than that of dual-income households sharing identical living spaces.
When daily electricity and gas standing charges combine to exceed £300 to £350 per year before a single kilowatt-hour of power or thermal unit is consumed, the solo earner operates under an irreducible base cost. Dual-earner couples effectively halve this overhead per capita, allowing them to dilute fixed regulatory levies across two wage envelopes.
Directly funded from one gross salary stream without cost-sharing.
Fixed distribution levies spread across two net household revenues.

Rural off-grid properties and heating oil volatility
Over four million British properties do not connect to the national gas grid, relying instead on heating oil, liquefied petroleum gas, or electric storage heaters. Households in rural England, Wales, and Northern Ireland face independent fuel delivery markets that are entirely exempt from the Ofgem default tariff cap. These families must purchase bulk fuel deliveries upfront, exposing them to extreme price spikes and seasonal supply crunches.
Metered Continuous Supply
- Protected by the statutory Default Tariff Cap quarterly price controls.
- Smooth monthly direct debits distributed evenly across all twelve calendar months.
- Continuous pipe supply eliminating upfront capital liquidity requirements.
Uncapped Spot Delivery Squeeze
- Entirely exempt from Ofgem tariff caps; subject to global petroleum spot swings.
- Requires minimum order volumes of 500 to 1,000 litres paid immediately upon order.
- Acute winter cash flow crisis when oil refilling coincides with holiday expenditures.

Landlords pay for heating upgrades but do not pay utility bills. Tenants pay utility bills but lack the legal right or capital to replace boilers, insulate lofts, or install heat pumps.
Private renters versus owner-occupiers
Tenants in the private rented sector face severe constraints when trying to manage their energy consumption. Renters cannot make capital investments in double glazing, wall insulation, modern heat pumps, or efficient condensing boilers. Many live in properties with low Energy Performance Certificate (EPC) ratings of D, E, or lower, forcing them to burn significantly more fuel to achieve habitable warmth compared to homeowners who can upgrade their insulation.
While an owner-occupier in income Quintile 3 can choose to spend savings on cavity wall insulation or draft-proofing to depress their heating requirement by 20% to 35%, a private renter in the same income band has no such agency. The tenant must either endure cold interior temperatures or surrender higher proportions of their weekly earnings to keep an uninsulated solid-brick structure habitable.
The technical threshold of fuel poverty
Fuel poverty in England is measured using the Low Income Low Energy Efficiency (LILEE) metric. Under this standard, a household is considered fuel poor if they reside in a home with an EPC rating of band D or below and their disposable income after housing and energy costs falls below the official poverty line. This framework underscores that high tariffs alone do not cause fuel poverty; structural building inefficiency is an equal partner in driving household distress.
EPC Band D, E, F, or G
The property fails modern thermal retention benchmarks, characterized by uninsulated solid walls, single glazing, unlagged lofts, or antiquated non-condensing boiler systems.
Residual Disposable Income
After meeting necessary housing rents or mortgage service alongside modeled fuel expenditure, remaining family income dips below 60% of national median equivalized income.
Dual-Variable Entrapment
Subsidizing tariff rates without retrofitting building envelopes merely treats symptoms; raising earnings without insulating draughty homes leaves families chronically exposed.
Regional budget variations across the UK
Disposable income margins after basic utilities vary considerably across regions. In areas like the North East of England and the South Wales valleys, average earnings lag behind national benchmarks while energy distribution tariffs remain elevated. Consequently, families in these communities face a tighter squeeze on discretionary cash flow than households in metropolitan areas where higher median wages provide a larger buffer against identical tariff rates.
Lower regional median pay combined with northern climatic degree-day cooling demands results in higher average winter fuel consumption per capita.
Older uninsulated housing stocks in industrial valleys create persistent heat dissipation, straining family budgets dependent on manufacturing and care salaries.
While housing rents are substantially higher, elevated median earnings provide a thicker cushion against regulated domestic energy rates.
Long-term consequences for family finances
Sustained exposure to high utility bills degrades household resilience over multiple years. Families forced to cut grocery budgets, defer dental care, or turn off central heating during winter months incur indirect health and social costs. Furthermore, when lower-income households cannot build emergency savings cushions, unexpected car repairs or appliance breakdowns push them into high-cost credit, turning temporary energy spikes into chronic debt burdens.
Zero Emergency Buffer
When utility bills consume 10% to 15% of take-home earnings, monthly voluntary contributions to deposit accounts cease entirely, leaving households defenseless against unexpected shocks.
High-Cost Borrowing Spirals
Inability to fund boiler breakdowns or vehicle MOTs out of routine cash flow triggers borrowing on revolving credit cards or personal loans, institutionalizing compound interest costs.
Damp & Ambient Cold Injury
Rationing boiler run-times produces persistent condensation, mould proliferation, and worsening respiratory symptoms in young children and elderly residents, increasing NHS demand.
Assessing potential policy solutions
Addressing the household utility burden requires clear evaluation of proposed reforms. Potential interventions include introducing a targeted social tariff for vulnerable households, transferring policy levies off electricity bills onto general taxation, and restructuring standing charges to reward lower consumption. Each policy involves clear trade-offs between government spending, consumer incentives, and supplier sustainability that must be assessed using empirical data.
What is a targeted social tariff and who would qualify?
Why are legacy environmental levies placed on electricity bills rather than gas?
Can daily standing charges be shifted into volumetric unit rates?
How does the UK's housing insulation rate compare to northwestern Europe?
Connect wage trajectories with tariff realities
Examine how gross weekly earnings have moved against core inflation indices since 2021, or inspect our data methodology and sovereign reporting standards.