
Breaking down the components of energy bills
Household energy bills are composed of multiple distinct charges, regulatory levies, and infrastructure costs that go far beyond the direct cost of fuel. Understanding how these separate elements are calculated explains why bills remain elevated even when headline wholesale gas markets experience downturns. Here is an objective breakdown of how Ofgem regulates tariffs and where your money goes.
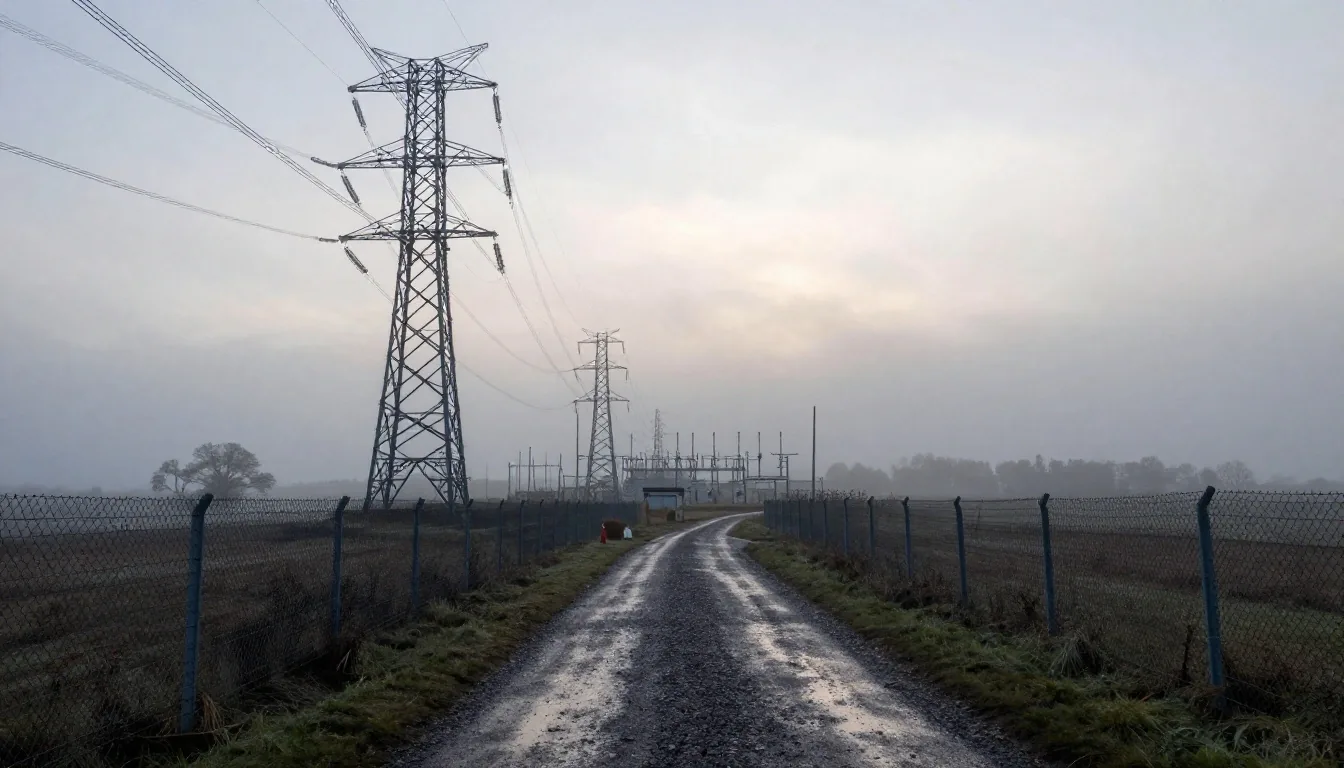
Transmission & Grid Balancing
Physical transmission infrastructure across Great Britain operates 24 hours a day to connect remote generation to population centres.
Variable vs Fixed Charges
Every domestic tariff separates fuel into unit rates per kilowatt-hour and unavoidable standing charges per day, fixing baseline costs regardless of consumption.
Hedging Price Lag
Suppliers purchase gas and power months ahead. Wholesale commodity reductions take up to two quarterly Ofgem cycles to appear on residential meters.
Household Simulation
Calculate the direct impact of standing charges and wholesale changes against your typical income band.
The structure of domestic energy bills
A standard dual-fuel energy bill is divided into two primary mechanisms: the unit rate (charged in pence per kilowatt-hour) and the daily standing charge (charged in pence per day).
The Variable Unit Rate
The unit rate reflects the variable cost of the gas or electricity your home consumes. When your central heating fires up or kitchen appliances run, meters record this physical flow. In the Ofgem pricing framework, the unit rate accounts for the raw commodity itself, losses during high-voltage transportation, and variable commercial supply costs. Reducing heating schedules or insulating walls directly reduces this specific charge.
Behavioral Sensitivity
Directly controllable by adjusting thermostat settings, draught-proofing, and equipment efficiency.
The Daily Standing Charge
The standing charge covers the fixed infrastructure, maintenance, and policy costs required to keep the supply connected to your property. Even if a home turns off its main circuit breaker and shuts down every gas radiator for a month, this fee continues to accrue every single day. It includes payments to network operators for maintaining poles, wires, and pipes, alongside social levies and supplier failure debt.
Inflexible Fixed Overhead
Applies to every active meter point regardless of household income or zero energy consumption.
Wholesale energy purchasing and hedging
Wholesale commodity costs make up the largest individual portion of an energy bill. Energy suppliers rarely buy power on the spot market for immediate residential use; instead, they purchase forward contracts months in advance through a practice called hedging.
While hedging protects consumers from sudden daily market spikes during geopolitical disruptions or cold snaps, it also delays the speed at which falling wholesale prices filter down into retail domestic tariffs. Suppliers lock in wholesale contracts for six, twelve, or eighteen months into the future. When spot gas prices crash at the National Balancing Point (NBP), companies must first exhaust the expensive volume contracts purchased in prior quarters before lowering customer prices.
Why Spot Prices Do Not Match Your Bill
News reports frequently cite daily day-ahead gas prices plunging to pre-crisis levels. Because retail suppliers buy forward across moving multi-month hedging windows mandated by risk management protocols, the retail price reflects the weighted average of contracts executed across previous seasons.
Hedging Cycle Impact
Suppliers hedge across rolling seasonal contracts to prevent sudden insolvency during wholesale market volatility. When gas prices spike, customers are temporarily insulated; when gas prices drop, tariffs descend gradually over subsequent quarters.
Network distribution and transmission charges
Transferring electricity from offshore wind farms and power stations to local substations requires an extensive high-voltage transmission network managed by the National Grid, alongside regional distribution networks.
Transmission Network Use
The costs of maintaining 400kV and 275kV high-voltage lines, subsea interconnectors, and high-capacity transformer substations are recovered via Transmission Network Use of System (TNUoS) fees, which fund the National Grid Electricity System Operator.
Regional Distribution Use
Regional Distribution Network Operators (DNOs) manage the lower-voltage neighborhood networks that carry power directly into residential streets. Maintaining roadside substations, step-down transformers, and subterranean conduits is billed via DUoS tariffs.
Gas Mains Pipeline Network
Gas distribution companies (such as Cadent, Northern Gas Networks, SGN, and Wales & West) replace ageing metallic gas mains with polyethylene piping to minimize leakages and maintain safe operating pressure up to household meters.
Regional Disparity in Network Tariffs
Because distribution network costs are allocated regionally based on population density and terrain ruggedness, rural areas (such as North Wales, Merseyside, and Northern Scotland) historically carry higher standing charges than densely populated regions like London.
Policy levies and green transition funding
Successive UK governments have placed social and environmental policy funding onto household energy bills rather than financing them exclusively through general taxation. These levies support programs like the Warm Home Discount, Energy Company Obligation schemes for insulation retrofits, and the Renewables Obligation.
Because electricity carries a disproportionate share of legacy green subsidies compared to natural gas, households using electric heat pumps or electric immersion heaters have historically paid higher policy contributions per unit of heat than households burning gas.
Placing social welfare and renewable generation subsidies onto utility bills functions as a regressive flat charge, taking a larger percentage of disposable income from low-earning households than funding via progressive income tax.
Key Levies Incorporated into Current Bills
Requires licensed suppliers to install energy efficiency measures—such as cavity wall insulation, loft insulation, and boiler upgrades—in fuel-poor and vulnerable households across Great Britain.
A legacy support mechanism requiring electricity suppliers to source an increasing proportion of power from accredited large-scale renewable generators, funded through electricity unit rates.
Provides an annual £150 direct rebate on winter electricity bills for pensioners on Guarantee Credit and low-income households with high calculated energy costs, cross-subsidized by all active domestic accounts.
Payments made to generation stations (including gas turbines and battery storage) simply to remain available as standby backup during peak winter evenings when wind generation drops.
The mechanics of the Ofgem price cap
Every three months, the regulator updates the Default Tariff Cap using a transparent statutory formula. This formula accounts for historical wholesale costs, operating costs, network charges, policy levies, VAT, and a regulated modest allowance for supplier profit. The widely quoted annual figure is not a maximum bill, but an illustrative annual cost for a household using an average volume of gas and electricity.
Default Tariff Cap Breakdown Equation
Formula: C = W + N + P + O + E + VWholesale Cost Allowance
Calculated by sampling forward market contracts across an explicit observation window preceding each regulatory quarter.
Network Transmission & Pipes
Pass-through allowance ensuring regulated monopoly transmission and distribution operators recover approved infrastructure maintenance.
Policy & Environmental Levies
Statutory social programs, renewable subsidies, and carbon reduction schemes mandated by government departments.
Operating Costs & Bad Debt
Customer service centers, smart meter rollouts, billing software, and allowances for customer debt write-offs due to arrears.
EBIT Regulated Margin
Regulated Earnings Before Interest and Taxes margin (typically around 1.9% to 2.4%) allowed for efficient supplier operations.
Value Added Tax (5%)
Statutory 5% domestic fuel VAT rate applied to the aggregate sum of all fuel, standing charge, and levy charges on the invoice.
Why standing charges have increased steadily
Standing charges have risen significantly over recent regulatory periods. A major driver was the supplier failure regime: between 2021 and 2022, nearly thirty domestic retail energy suppliers collapsed due to inadequate hedging practices.
The costs of transferring millions of affected customers to new suppliers under the Supplier of Last Resort (SoLR) process and honoring lost consumer credit balances were socialized across all domestic bills. Because Ofgem allocated a large share of these multi-billion-pound mutualized industry failure costs onto daily standing charges rather than unit rates, the penalty was applied equally across every home, regardless of whether a household used substantial energy or lived in severe fuel conservation.
Impact on Low-Volume Consumers
When standing charges exceed 50 to 60 pence per day for electricity alone, a single pensioner living in an unheated flat pays roughly £20 per month simply to keep an electrical connection alive. Reductions in personal consumption cannot lower this unavoidable fixed invoice.
28 retail suppliers went bankrupt as spot gas prices escalated past capped residential price ceilings.
Surviving major suppliers absorbed millions of stranded accounts. Customer credit balances were guaranteed via the Supplier of Last Resort levy.
Billions in unhedged power liabilities and administrative onboarding costs were spread onto standing charges across every UK meter.
Ongoing policy debate exploring whether to shift mutualized failure debt from daily standing charges into volumetric unit rates to ease low-income burdens.
The difference between prepayment and direct debit billing
Payment methods affect the final unit costs paid by households. Customers paying by fixed monthly direct debit traditionally paid the lowest unit rates because suppliers benefited from predictable cash flow. Prepayment meter users historically faced higher charges due to the administrative cost of physical token networks, though regulatory interventions have moved to align prepayment caps with direct debit rates to reduce penalties on vulnerable homes.
Smoothed Monthly Direct Debit
Suppliers project 12-month annual consumption and bill an equal one-twelfth payment each month. During warm summer months, households build up an account credit cushion; during cold winter months, heating bills draw that credit down.
- Eliminates massive winter cash flow shocks for families
- Direct debit discount benchmarked into Ofgem price cap baseline
- Risk of excessive summer direct debit accumulation if estimated high
Prepayment Meter (Key / Card / App)
Energy is bought in advance. If credit runs out and emergency credit is exhausted, meters disconnect immediately. Daily standing charges continue to accrue during disconnections and are deducted instantly upon next top-up.
- Absolute visibility over real-time pound consumption per day
- Ofgem Energy Price Guarantee alignment ended prepayment unit surcharges
- High risk of winter self-disconnection when household budget collapses
Measuring real consumption in kilowatt-hours
Rather than focusing solely on monthly pound amounts, monitoring actual kilowatt-hour (kWh) usage reveals true consumption patterns.
Electricity Benchmark
Standard medium dual-fuel UK household electricity volume (Profile Class 1). Powers standard refrigeration, lighting, appliances, entertainment, and washing machines.
Gas Benchmark
Standard medium dual-fuel UK home gas heating and cooking volume. Heavily weighted toward the five winter months (November through March).
Real-World Divergence
Variations in building insulation, heating habits, boiler efficiency, and family size cause real-world consumption to deviate widely from these benchmark figures. A drafty Victorian terrace can easily consume over 18,000 kWh of gas per winter.

Why kWh is the only metric that tracks physical efficiency
When comparing winter bills across different years, comparing pound values obscures whether your home became more energy-efficient or whether unit rates and standing charges inflated underneath. By checking actual kilowatt-hours on smart meter displays or paper dockets, households isolate true thermal performance from regulatory tariff fluctuations.
Frequently asked questions about UK energy costs
Concise explanations of regulatory terms, bill anomalies, and market mechanics.
Is the headline Ofgem price cap the maximum amount my household can be charged?
No. The price cap sets a maximum limit on the rates your supplier can charge for each kilowatt-hour of gas and electricity and a maximum daily standing charge. The widely publicized annual figure (such as £1,717 or £1,800) is merely an illustrative figure for a hypothetical household using average consumption (2,700 kWh electricity and 11,500 kWh gas). If your household consumes more energy, your total bill will exceed that figure.
Why can I not opt out of paying the daily standing charge?
The standing charge pays for the physical connection between your property and the national gas pipes and electric wires, emergency repairs, and socialized debt. As long as a property has an energized meter connected to the network, network operators levy these maintenance fees onto your supplier, which are then passed directly onto your bill. The only way to completely avoid standing charges is to formally decommission and physically remove the meter point.
How do wholesale gas prices dictate electricity prices when the UK has significant renewable power?
Under the UK's marginal pricing wholesale market design, the final unit of generation required to satisfy electricity demand at any half-hour interval sets the clearing price for all generators. Because gas-fired combined-cycle gas turbine (CCGT) stations are frequently the marginal plant called upon to balance the grid when wind and solar output fluctuate, high gas costs dictate the clearing price paid across the entire market, including low-cost renewable generation.
Why does my bill carry a 5% VAT rate instead of the standard 20%?
Domestic fuel and power in the United Kingdom qualify for a statutory reduced rate of Value Added Tax (VAT) of 5%, as opposed to the standard 20% rate applied to commercial power and general consumer goods. This reduced rate applies automatically to domestic dual-fuel invoices.
Track the real friction between UK wages and household utility bills
Compare historical wage index trajectories with escalating domestic tariffs across different UK income deciles and regional housing archetypes.